HAMPTON ROADS, Va. (WAVY) – A 10 On Your Side investigation into whether or not Hampton Roads is getting its fair share of transportation dollars from the Virginia state budget produced surprising results.
There is a long-standing belief we do not get our fair share, and that we are greatly overshadowed by Northern Virginia, which sucks up most of that money due to their power and clout in Richmond and the General Assembly.
But is that true? Do we get our fair share of funding in Hampton Roads?
We began our search for the truth with road funding statistics from the Virginia Department of Transportation.
What we found not only surprised us, but also surprised some elected public officials who are in the know, and who admit they were shocked by what 10 On Your Side uncovered.
At $3.5 billion, the Hampton Roads Bridge-Tunnel expansion is the largest transportation project in Virginia history.
It connects Norfolk to Hampton.
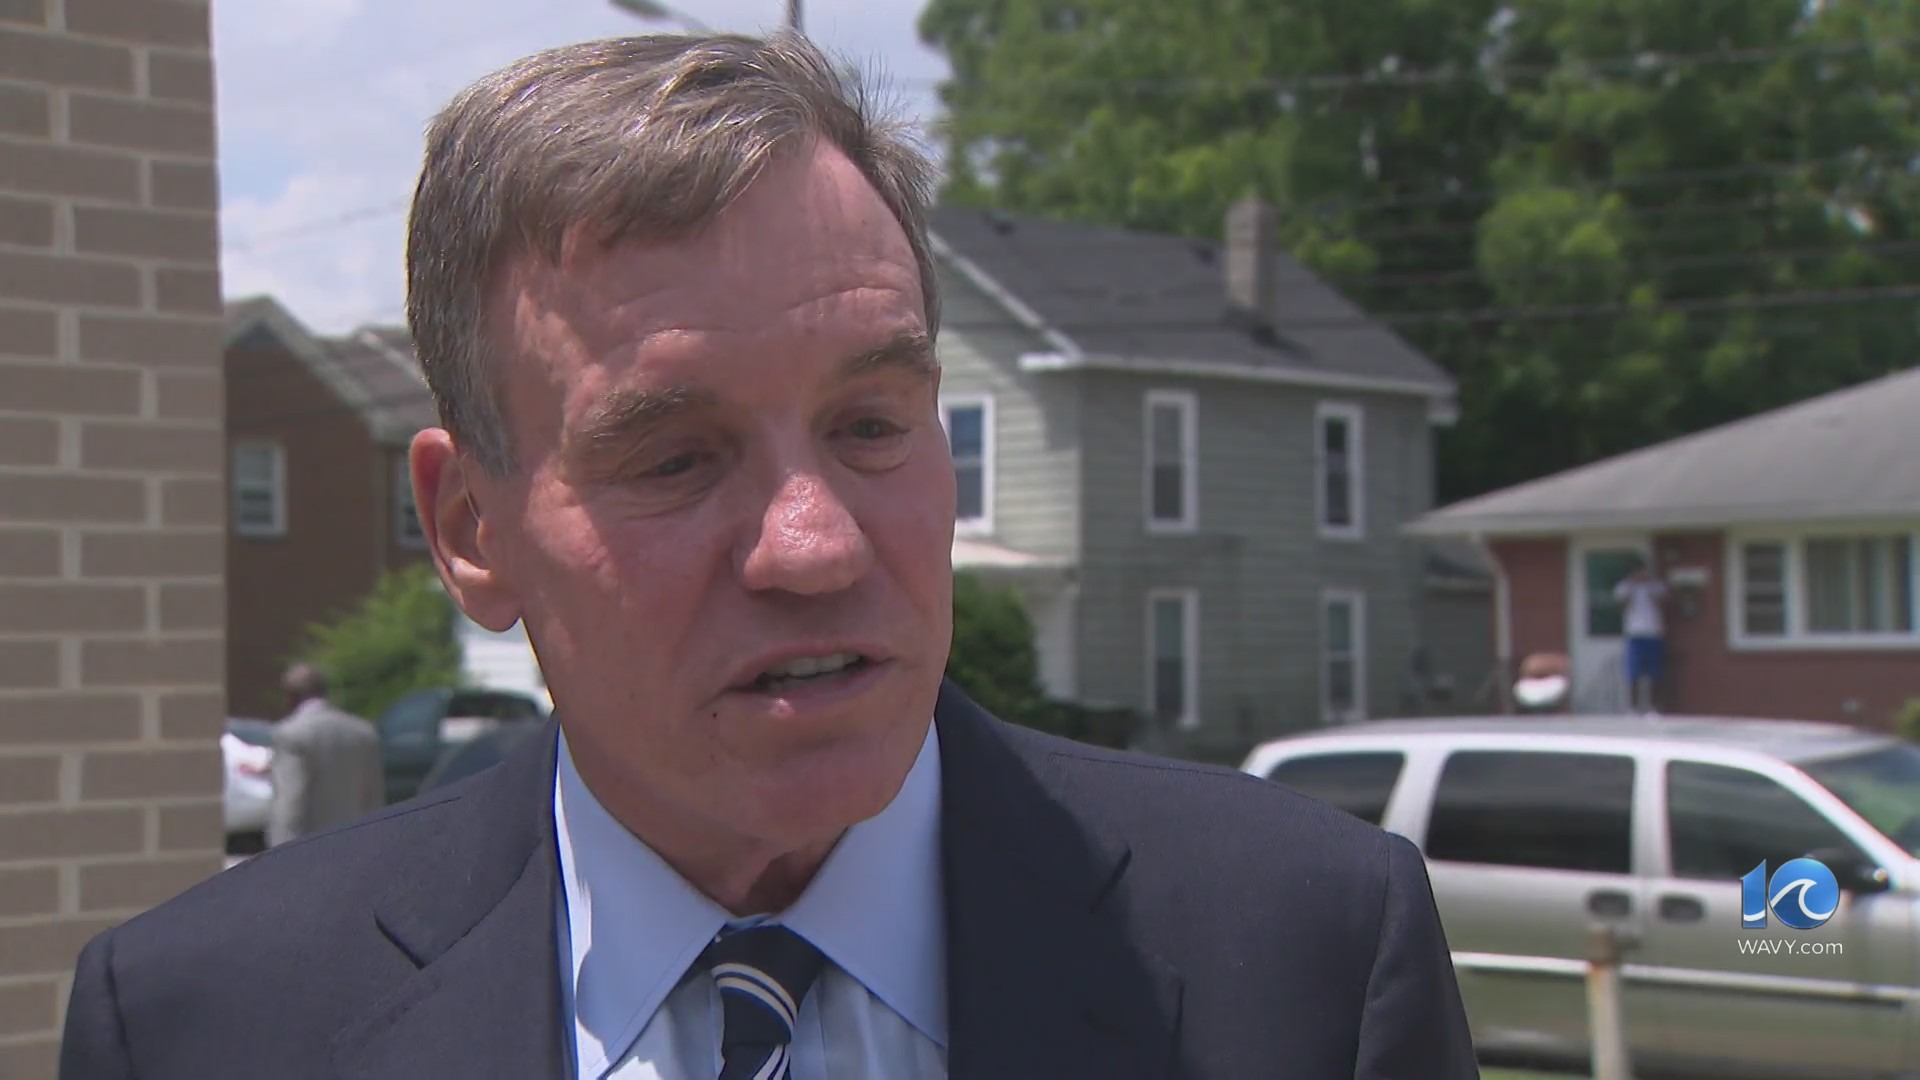
WAVY showed Hampton Mayor Donnie Tuck the statistics.
“That is interesting,” Tuck said. “I have not seen these figures before, but I do really find them interesting.”
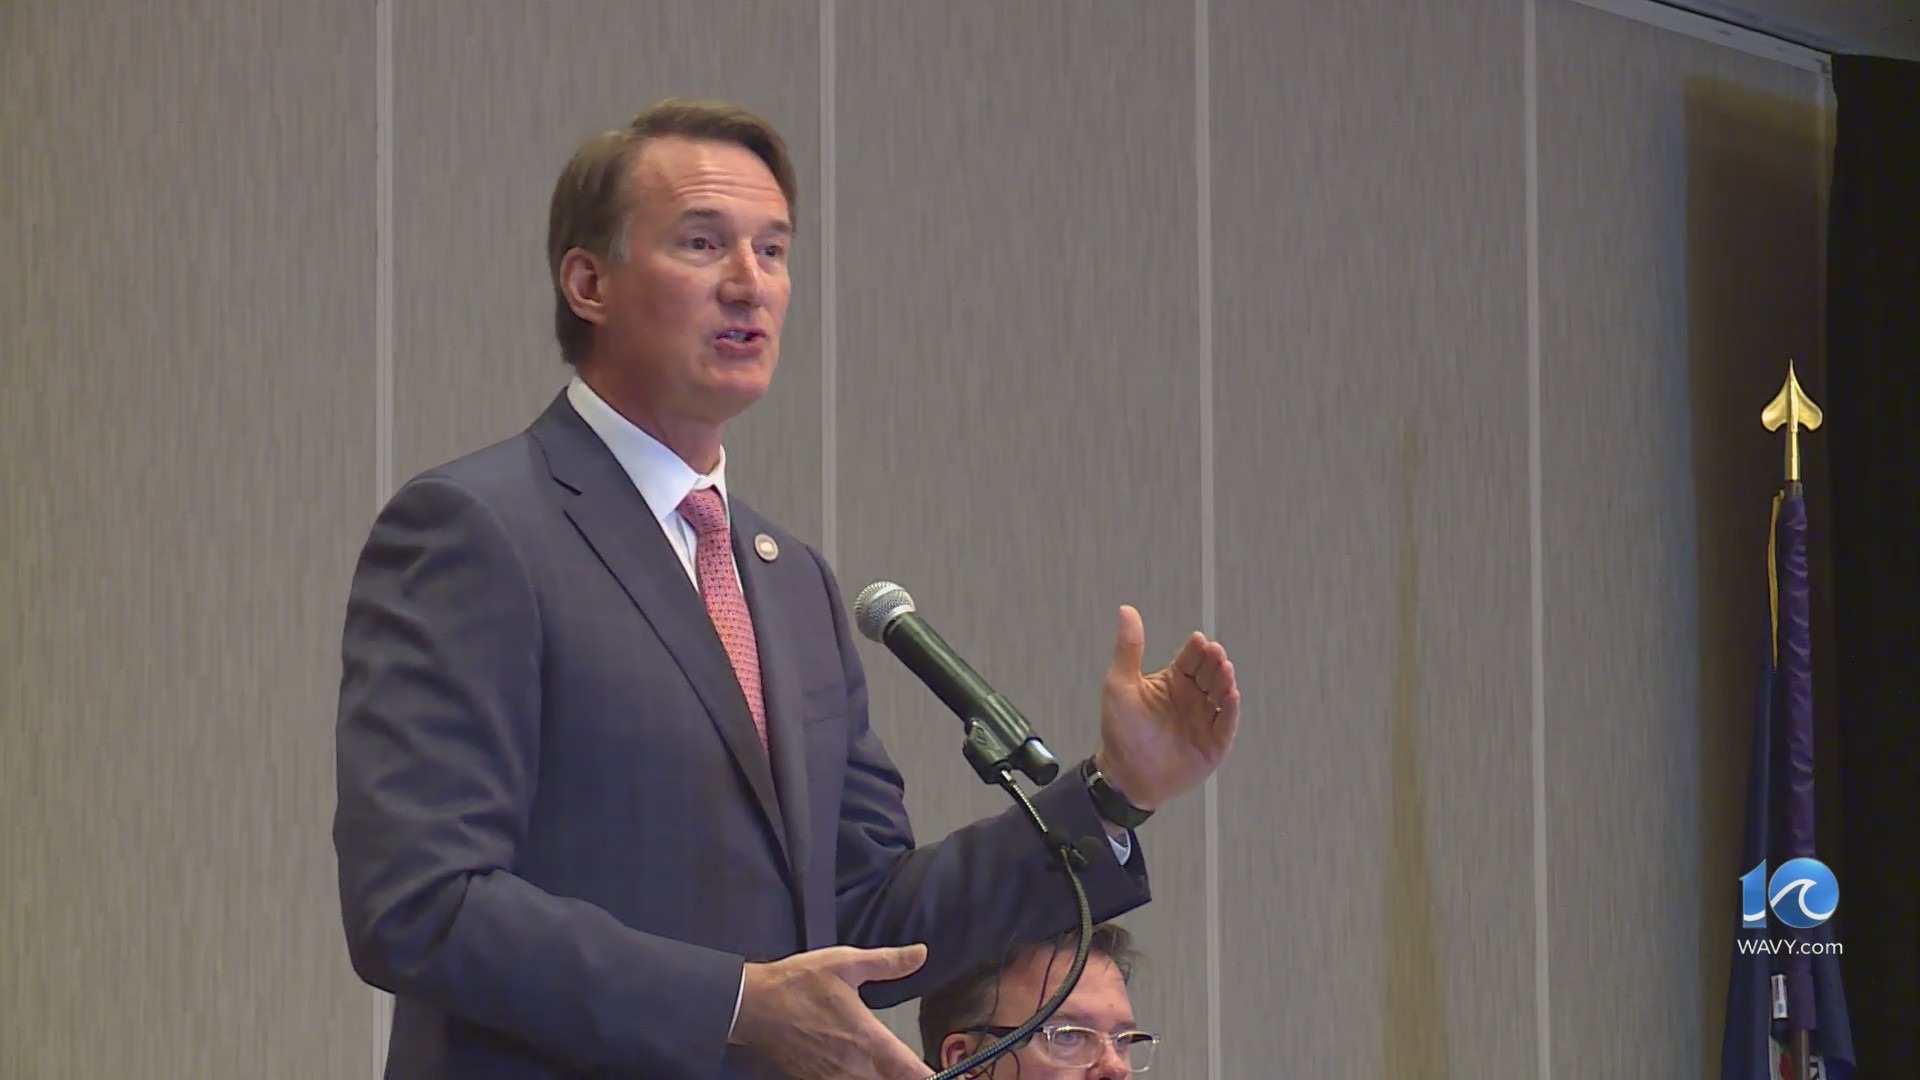
State Sen. Lionell Spruill is the chairman of the Hampton Roads Caucus, representing all Democrats and Republicans, and he also serves on the State Senate Transportation Committee.
“In Hampton Roads do we get our fair share? No; the reason is we haven’t been working together,” Spruill said.
State Sen. Bill DeSteph (R-Virginia Beach) is also on the Senate Transportation Committee.
“Do we get our fair share? On the federal government side, we do not,” DeSteph said. “I do not believe we do.”
Highway Construction Programs – Allocations by District
| $ in thousands | FY 2019 | FY 2020 | FY 2021 | FY 2022 | FY 2023 | 5-Year Total | % |
| Highway Construction Programs – Allocations by District | |||||||
| Bristol | 48,070 | 76,680 | 102,141 | 75,544 | 105,425 | 407,860 | 8.7% |
| Culpeper | 23,506 | 15,918 | 62,623 | 72,724 | 66,495 | 241,267 | 5.2% |
| Fredericksburg | 48,663 | 64,454 | 108,289 | 88,058 | 93,607 | 403,071 | 8.6% |
| Hampton Roads | 129,990 | 135,978 | 161,601 | 119,425 | 184,154 | 731,148 | 15.7% |
| Lynchburg | 29,918 | 25,348 | 58,039 | 67,441 | 73,763 | 254,509 | 5.5% |
| Northern Virginia | 76,755 | 65,841 | 98,847 | 154,985 | 226,591 | 623,019 | 13.4% |
| Richmond | 73,278 | 61,650 | 114,610 | 147,630 | 144,040 | 541,208 | 11.6% |
| Salem | 61,141 | 76,925 | 125,038 | 124,396 | 93,951 | 481,450 | 10.3% |
| Staunton | 55,286 | 41,885 | 104,351 | 87,013 | 101,664 | 390,198 | 8.4% |
| Statewide | 28,868 | 30,895 | 131,284 | 245,025 | 155,828 | 591,900 | 12.7% |
| TOTAL | 575,475 | 595,574 | 1,066,822 | 1,182,240 | 1,245,517 | 4,665,629 | 100.0% |
Here’s what our investigation uncovered.
ACCORDING TO VDOT:
Virginia has given $4.665 billion dollars for highway construction since fiscal year 2019 and data shows Hampton Roads got the most funding, with more than $731 million, or 15.7%.
Followed by Northern Virginia, with more than $623 million, or 13.4%, then Richmond, with $541.2 million, or 11.6%
WAVY showed these numbers to Spruill.
“I am tickled to death,” Spruill said. “I didn’t know that we were number one. I always thought Northern Virginia was, so you have really changed my mind.”
We also showed the numbers to State Del. Barry Knight (R-Virginia Beach).
“This is the first time I’m seeing these numbers like this,” Knight said. “I haven’t seen it before.”
Knight is the chairman of the powerful House Appropriations Committee, known as the “Money Committee,” and you cannot overstate the power he carries in that position. His fingerprints are all over the state budget.
“It shows we are getting our fair share and a little bit more,” Knight said.
Knight also pointed out that none of this funding includes the $470 million the region got for what is known as the “29-mile gap project” widening Interstate 64 from two to four lanes heading east and west through New Kent County.
“We are one area between Hampton Roads and Richmond,” Knight said. “And that is our gateway. We are a community at the end of a cul-de-sac, and we have to have a way in and a way out.”
Knight also made the case on why requesting the $470 million from the state was properly granted.
“We were told the Port (of Virginia) couldn’t expand,” Knight said. “And the Navy said, not only could they not expand, but they could also have to contract, so we put our money where our mouth is.”
VDOT Maintenance and Operations
| FY 2019 | FY 2020 | FY 2021 | FY 2022 | FY 2023 | |
| Maintenance | |||||
| City/County Street Payments | |||||
| Bristol | 16,479,576 | 16,602,471 | 16,910,513 | 17,187,325 | 18,336,451 |
| Culpeper | 8,647,843 | 8,641,475 | 8,775,246 | 8,951,337 | 9,542,618 |
| Fredericksburg | 3,759,096 | 3,772,802 | 3,856,829 | 3,996,930 | 4,354,842 |
| Hampton Roads | 191,086,733 | 191,727,335 | 196,647,386 | 199,942,725 | 213,516,414 |
| Lynchburg | 27,805,297 | 27,812,174 | 28,433,355 | 28,898,787 | 30,807,699 |
| Northern Virginia (includes Arlington) | 45,308,030 | 45,411,907 | 46,415,190 | 47,260,426 | 49,995,329 |
| Richmond (includes Henrico) | 94,629,015 | 94,661,705 | 96,436,841 | 98,178,424 | 103,577,021 |
| Salem | 41,310,142 | 41,448,950 | 42,412,541 | 43,906,062 | 46,957,467 |
| Staunton | 27,593,638 | 27,731,745 | 28,484,944 | 29,151,120 | 31,097,166 |
| TOTAL | 456,619,369 | 457,810,563 | 468,372,844 | 477,473,134 | 508,185,007 |
| VDOT Maintenance and Operations | |||||
| Bristol | 169,789,723 | 169,789,722 | 178,427,985 | 157,846,686 | 167,084,033 |
| Culpeper | 112,044,005 | 112,044,006 | 102,658,507 | 76,535,729 | 91,802,678 |
| Fredericksburg | 109,995,043 | 109,995,041 | 112,689,550 | 120,367,627 | 123,778,924 |
| Hampton Roads | 193,335,840 | 193,335,839 | 191,377,780 | 189,893,203 | 204,412,450 |
| Lynchburg | 164,084,452 | 108,732,602 | 112,352,209 | 90,723,307 | 99,657,710 |
| Northern Virginia | 317,476,067 | 317,476,071 | 304,330,019 | 226,520,525 | 305,156,982 |
| Richmond | 167,278,340 | 222,630,194 | 216,742,812 | 193,145,531 | 214,948,875 |
| Salem | 180,032,518 | 180,032,518 | 173,023,966 | 158,131,123 | 176,000,035 |
| Staunton | 149,052,451 | 149,052,451 | 140,491,456 | 125,188,088 | 141,396,000 |
| Central Office | 161,063,496 | 165,022,129 | 209,793,837 | 418,290,079 | 540,612,602 |
| TOTAL | 1,724,151,935 | 1,728,110,573 | 1,741,888,121 | 1,756,641,898 | 2,064,850,289 |
But there’s more.
According to VDOT, Virginia allocated $2.38 billion for road maintenance since fiscal year 2019.
Hampton Roads was number one every year, receiving 42% of that, or nearly $992,920,593.
Followed by Richmond, with $487,483,006, or 21%, then Northern Virginia, with $234,390,882, or 10%.
Mayor Tuck is also former chairman of the Hampton Roads Transportation Planning Organization. He seemed impressed when he saw the road maintenance numbers.
“I was not aware,” Tuck said. “We did not know we were getting so much money for maintenance, so that is impressive. I will discuss that with the people who comprise our commissions and boards, because I am sure it is new to them as well.”
Time now for a huge reality check.
“These numbers, although impressive and appreciated by Hampton Roads leaders, the state money is not and has never been nearly enough,” said Bob Crum, Executive Director of the HRTPO.
“It is important to remember that $731 million we received, and we appreciate it,” Crum said. “But it is not nearly enough to fund the magnitude and size of projects under construction you see today.”
To Crum’s point, we now have five transportation projects underway in Hampton Roads costing $5.8 billion; 92% of that paid for by Hampton Roads taxpayers from the regional state sales tax and gas tax.
Last year, that brought in $243 million, and it is exclusively for roads, and all of it stays in Hampton Roads.
Those projects include the Hampton Roads Bridge-Tunnel expansion, the expansion of lanes on I-264 on the Peninsula, and the widening of the High-Rise Bridge.
Hampton Roads is able to tax people after the program was approved by the General Assembly.
In 2013, approved by the General Assembly, the Hampton Roads Transportation Accountability Commission, or HRTAC, was established as a funding mechanism to raise taxes for what is the Hampton Roads Transportation Fund.
HRTAC’s executive director is Kevin Page, and the Richmond and Northern Virginia regions have similar programs to raise taxes for roads.
“The only way we are going to advance these projects is through resources,” Crum said, “and a lack of resources has consequences, and thankfully our elected officials in Hampton Roads and the General Assembly have the foresight to really give us this opportunity.”
It should also be noted that in October 2016, there was a landmark regional decision that, as a region, Hampton Roads would unanimously move forward with the Hampton Roads Bridge-Tunnel expansion and a host of other projects.
“We are trying to make a case,” Knight said, “and I guess the Hampton Roads delegation has been pretty persuasive in the last four or five years in making our case for the funding.”
There is no doubt Hampton Roads has a lot of political power in Richmond. How that changes – who has power and who doesn’t – remains to be seen in what a watershed General Assembly election cycle it will be, in which all 100 seats in the House of Delegates and 40 seats in the State Senate are up for election.
It should also be noted that this transportation funding we are reporting on is not supposed to be political, but instead is formula-driven in a manner that determines where the greatest needs are, and where that funding should go.
Hampton Roads has been number one in funding for the last five years, but maybe not the next five years.
That’s where those regional taxes come in to build the roads that take us where we need to go.
“Many of us have been left with the impression that we are not getting our fair share,” Tuck said. “So I think it would be surprising to many of us, if not all of us, to see these numbers you have reported … which is great investigative reporting.”


