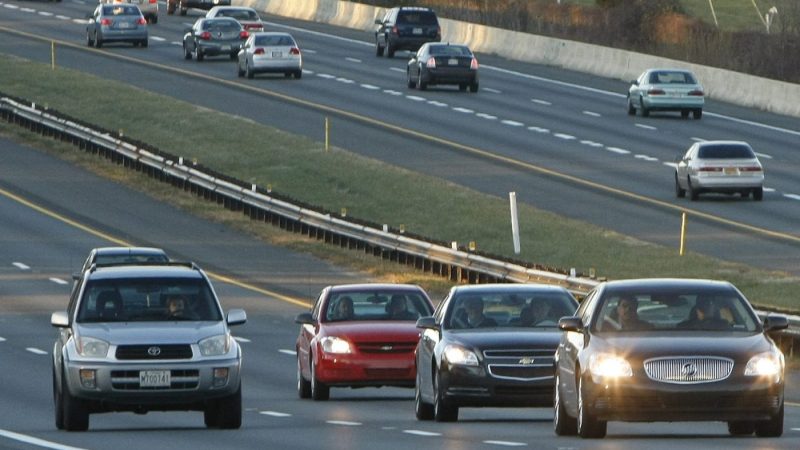
(NEXSTAR) – The pandemic-era days of light traffic on the roads are long gone, a new study from the Texas A&M Transportation Institute found.
Most of the country is back to its pre-COVID levels of congestion and traffic delays, said David Schrank, a senior research scientist and primary author of the Institute’s Urban Mobility Report. In some cities, despite having fewer total commuters on the road, things have actually gotten worse when compared to 2019.
For one thing, the commute is less predictable now, Schrank explained. With the proliferation of hybrid work schedules, it’s hard to predict when others in your area will be called into the office for an all-hands meeting or big presentation.
“On any given day, everybody might be going into the office and no one is expecting it,” Schrank said. “What if next Monday everybody gets called in? Then boom – it’s gridlock.”
(For what it’s worth, early data seems to indicate Monday is actually least popular day for workers to drive into the office, he said.)
The commute has also stretched longer thanks to more flexible work schedules. Some office workers may log on in the morning to do some work, then head into the office around 10 a.m. Or they’ll leave at 3 p.m. to beat the rush. But when everyone thinks like that, the commute time rush (and accompanying delays) creeps later into the morning and earlier into the afternoon.
People have also shifted to new cities since the pandemic, heading to the suburbs and exurbs for more space, but leaving them with a longer commute now that they’re back in the office. Sun Belt cities that have seen huge population growth, like Phoenix, have also seen a matching growth in traffic delays.
Another major factor driving worsening traffic delays has nothing to do with the back-to-office commute, the researchers found. In attempts to ease the supply chain woes we saw in 2020, and to improve shipping efficiency for the proliferation of online ordering, major retailers like Amazon have opened more warehouses around the country.
The goods from these mega-warehouses often get to your local store or to your doorstep on trucks. Now, in a post-pandemic world, truck congestion is an even bigger part of the problem than it was before.
Truckers are on the road at all times of day and on all major highways, contributing to road congestion that isn’t just during normal commute hours.
If you look at some of the cities that had worse traffic problems in 2022 than they did pre-pandemic, many of them are at the crossroads of major interstates.
“Places like Columbus, which has I-75 running right through it, so it’s a major corridor,” said Schrank. “Louisville, Nashville, they’re loaded with interstates, connecting places like Atlanta to Chicago. So some of that extra traffic in those kinds of places is due to increased commercial traffic and trucking.”
Port cities, like Los Angeles, Chicago and New York, also tended to see traffic rebound faster from COVID-era lows, Schrank explained, in part due to increased commercial traffic.
Though whether or not you feel like your commute has gotten worse can come down to hyperlocal conditions, Schrank explained. It can come down to the exact corridor you need to take to get to work, and how many other people have no choice but to go that way, too.
According to the Texas A&M Transportation Institute’s findings, the 20 metro areas that saw the biggest growth in total annual delay, as a percentage, between 2019 and 2002, were:
- Rochester, New York (10% worse)
- Bakersfield, California (10% worse)
- Laredo, Texas (10% worse)
- Provo, Utah (9% worse)
- Louisville, Kentucky (8% worse)
- Milwaukee, Wisconsin (8% worse)
- Bridgeport-Stamford, Connecticut (8% worse)
- New Haven, Connecticut (8% worse)
- Little Rock, Arkansas (8% worse)
- Oklahoma City, Oklahoma (7% worse)
- Riverside-San Bernardino, California (7% worse)
- Salt Lake City, Utah (7% worse)
- Phoenix-Mesa, Arizona (6% worse)
- Baton Rouge, Louisiana (6% worse)
- Colorado Springs, Colorado (6% worse)
- Stockton, California (6% worse)
- Charleston-North Charleston, South Carolina (5% worse)
- Omaha, Nebraska (5% worse)
- Sacramento, California (4% worse)
- Memphis, Tennessee (4% worse)
Meanwhile, some bigger cities are still experiencing much lower congestion than 2019. Washington, D.C., was still down 26% in total delays when compared to pre-pandemic and Boston was down 21%.
Many cities, from San Francisco to Dallas to Portland, Oregon, were still seeing a bit less traffic than pre-COVID. But in many cases, it’s only by 2% or 3% – which most drivers wouldn’t feel when out on the roads.


