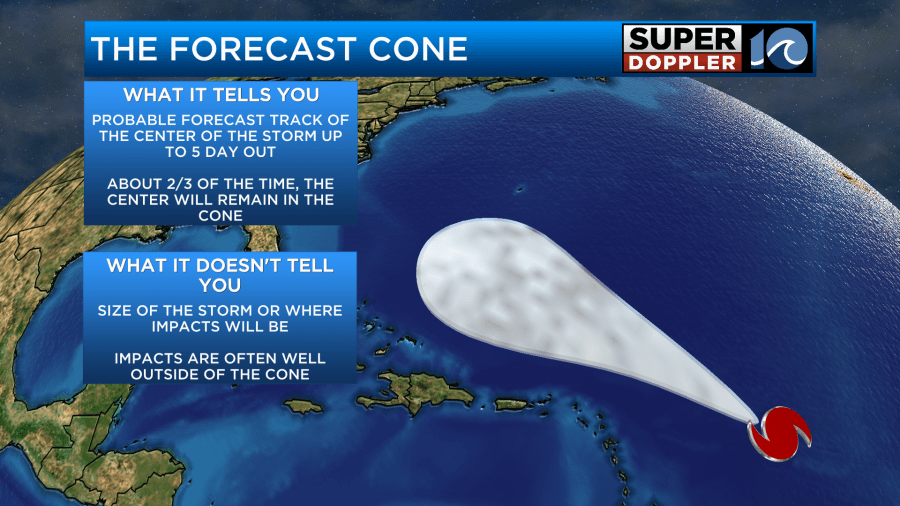
When a hurricane is moving across the ocean, the National Hurricane Center issues a forecast for it – which includes a 5 day forecast cone.
This cone, often called the “Cone of Uncertainty” indicates possible errors in the forecast.

The size of the cone does not change based on the certainty of the forecast- instead, the size of each circle is set each year so that two-thirds of historical official forecast errors over a 5-year sample fall within the circle. Below is the size at each forecast period, as provided by the National Hurricane Center.
| Forecast Period (hours) | 2/3 Probability Circle, Atlantic Basin (nautical miles) |
| 12 | 26 |
| 24 | 41 |
| 36 | 55 |
| 48 | 70 |
| 60 | 88 |
| 72 | 102 |
| 96 | 151 |
| 120 | 220 |
On average, 2/3 of the time, the center of the storm will remain inside the cone. However, there have been storms that have not behaved that way – so it’s important to remain vigilant if you’re inside or outside the cone. Also, keep in mind that the cone does not represent the storm’s size. Impacts such as wind, rain and waves can extend outside of the cone.


